Produces a time series plot of one or more variables from a tsibble. If the tsibble contains a multiple keys, separate time series will be identified by colour.
Arguments
- object
A tsibble.
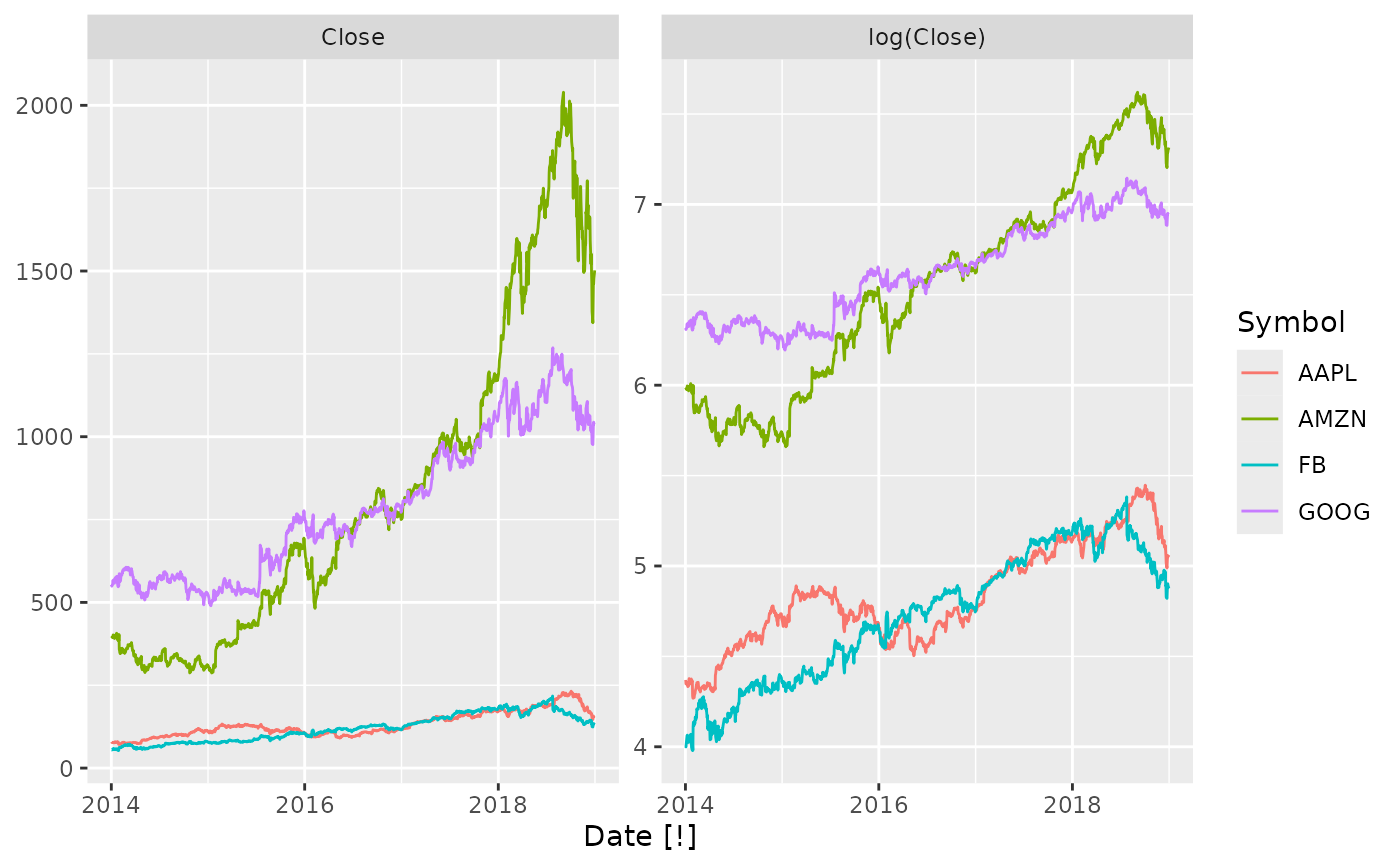
- .vars
A bare expression containing data you wish to plot. Multiple variables can be plotted using
ggplot2::vars().- ...
Further arguments passed to
ggplot2::geom_line(), which can be used to specify fixed aesthetics such ascolour = "red"orlinewidth = 3.