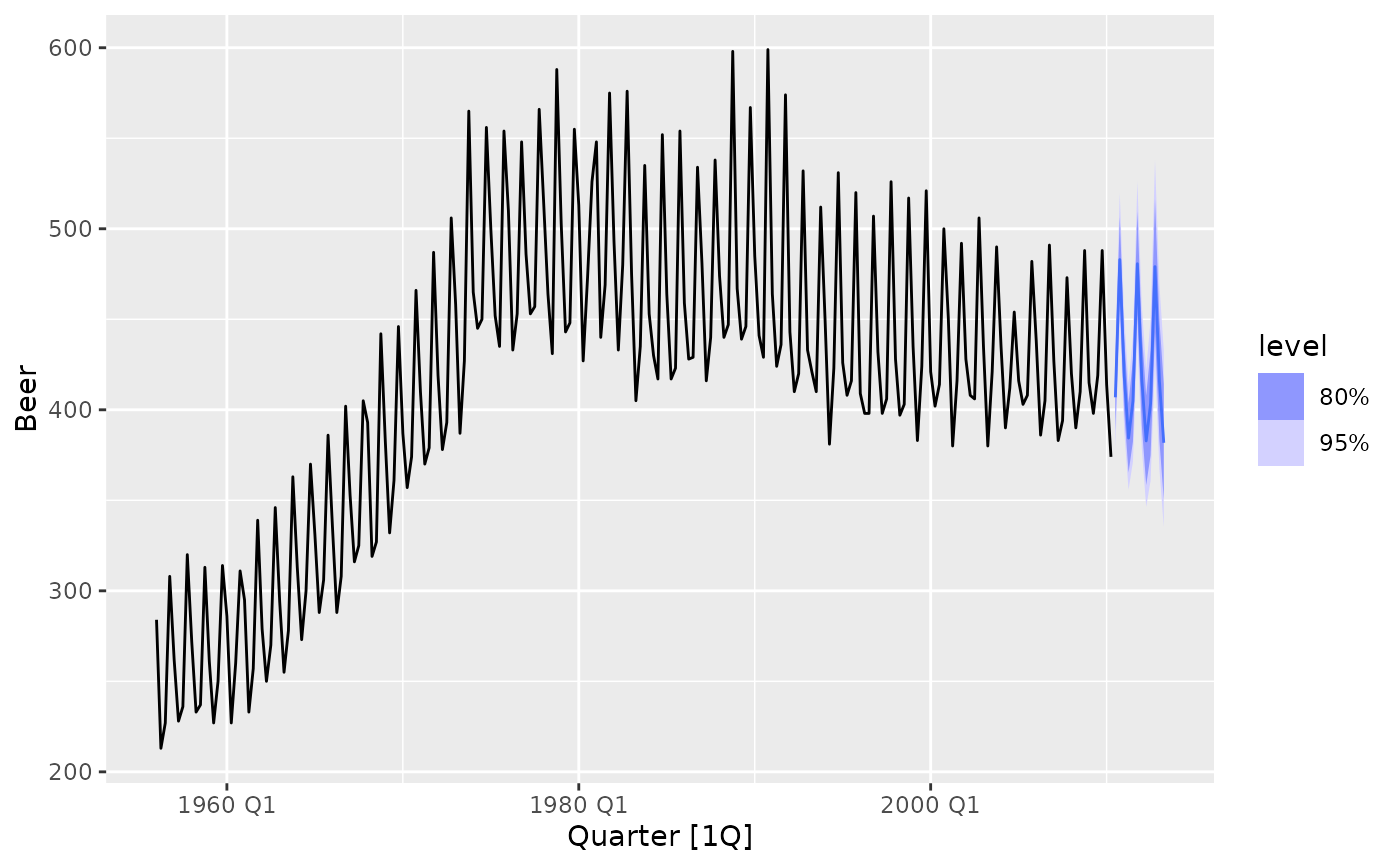
Produces a forecast plot from a fable. As the original data is not included
in the fable object, it will need to be specified via the data argument.
The data argument can be used to specify a shorter period of data, which is
useful to focus on the more recent observations.
Arguments
- object
A fable.
- data
A tsibble with the same key structure as the fable.
- level
The confidence level(s) for the plotted intervals.
- show_gap
Setting this to
FALSEwill connect the most recent value indatawith the forecasts.- ...
Further arguments passed used to specify fixed aesthetics for the forecasts such as
colour = "red"orlinewidth = 3.- point_forecast
The point forecast measure to be displayed in the plot.
Examples
library(fable)
library(tsibbledata)

fc <- aus_production %>%
  model(ets = ETS(log(Beer) ~ error("M") + trend("Ad") + season("A"))) %>%
  forecast(h = "3 years")

fc %>%
  autoplot(aus_production)
#> Warning: `autoplot.fbl_ts()` was deprecated in fabletools 0.6.0.
#> ℹ Please use `ggtime::autoplot.fbl_ts()` instead.
#> ℹ Graphics functions have been moved to the {ggtime} package. Please use
#>   `library(ggtime)` instead.

aus_production %>%
  autoplot(Beer) +
  autolayer(fc)
#> Warning: `autoplot.tbl_ts()` was deprecated in fabletools 0.6.0.
#> ℹ Please use `ggtime::autoplot.tbl_ts()` instead.
#> ℹ Graphics functions have been moved to the {ggtime} package. Please use
#>   `library(ggtime)` instead.
#> Warning: `autolayer.fbl_ts()` was deprecated in fabletools 0.6.0.
#> ℹ Please use `ggtime::autolayer.fbl_ts()` instead.
#> ℹ Graphics functions have been moved to the {ggtime} package. Please use
#>   `library(ggtime)` instead.
aus_production %>%
autoplot(Beer) +
autolayer(fc)
#> Warning: `autoplot.tbl_ts()` was deprecated in fabletools 0.6.0.
#> ℹ Please use `ggtime::autoplot.tbl_ts()` instead.
#> ℹ Graphics functions have been moved to the {ggtime} package. Please use
#> `library(ggtime)` instead.
#> Warning: `autolayer.fbl_ts()` was deprecated in fabletools 0.6.0.
#> ℹ Please use `ggtime::autolayer.fbl_ts()` instead.
#> ℹ Graphics functions have been moved to the {ggtime} package. Please use
#> `library(ggtime)` instead.