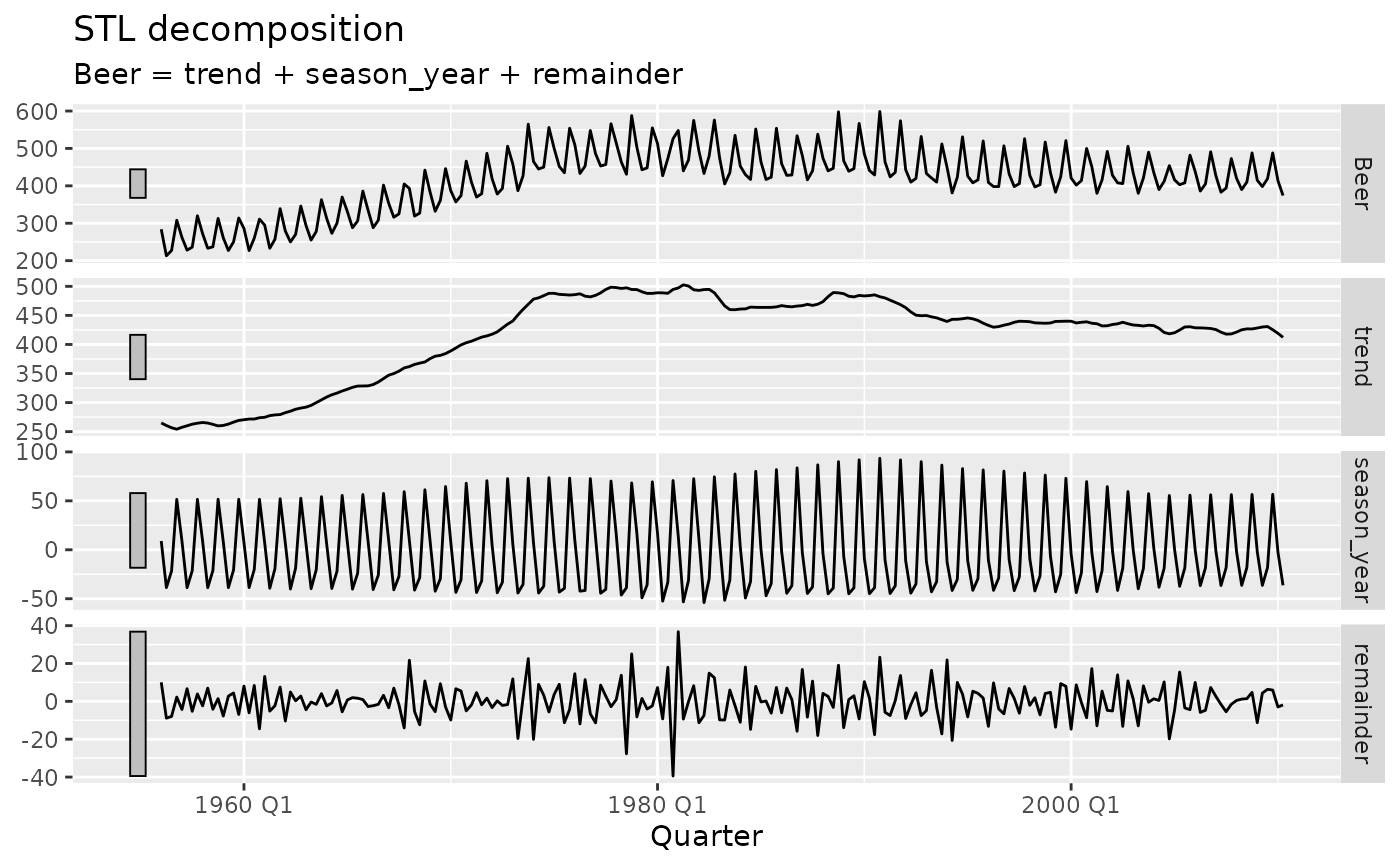
Produces a faceted plot of the components used to build the response variable of the dable. Useful for visualising how the components contribute in a decomposition or model.
Arguments
- object
A dable.
- .vars
The column of the dable used to plot. By default, this will be the response variable of the decomposition.
- scale_bars
If
TRUE, each facet will include a scale bar which represents the same units across each facet.- level
If the decomposition contains distributions, which levels should be used to display intervals?
- ...
Further arguments passed to
ggplot2::geom_line(), which can be used to specify fixed aesthetics such ascolour = "red"orlinewidth = 3.
Examples
library(feasts)
library(tsibbledata)
aus_production %>%
  model(STL(Beer)) %>%
  components() %>%
  autoplot()
#> Warning: `autoplot.dcmp_ts()` was deprecated in fabletools 0.6.0.
#> ℹ Please use `ggtime::autoplot.dcmp_ts()` instead.
#> ℹ Graphics functions have been moved to the {ggtime} package. Please use
#>   `library(ggtime)` instead.